Building useful datasets for
Earth System Model output
2024-10-20
analysing
high-resolution model output
can be slow
time to plot
the time it takes until the analysis plot is ready
- understanding the data
- coding the analysis
- getting the data
Useful output is
written once and
read at least once.
Idea
optimize output for analysis
(not write throughput)
understanding the data
datasets are
(for this talk)
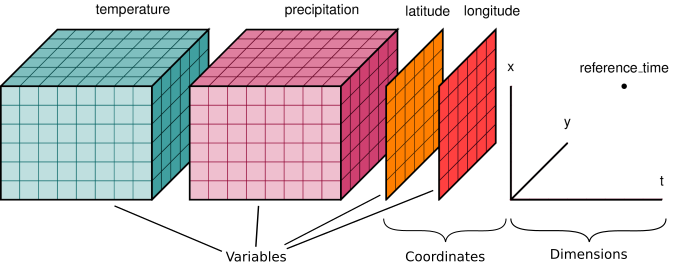
figure from xarray documentation
- n-dimensional variables
- shared dimensions
- coordinates
- attributes for metadata
datasets are not
- a single file
- a storage format
- shaped by storage & handling
we had: unstructured output
$ ls *.nc
ngc2009_atm_mon_20200329T000000Z.nc
ngc2009_oce_2d_1h_inst_20200329T000000Z.nc
ngc2009_atm_pl_6h_inst_20200329T000000Z.nc
ngc2009_lnd_tl_6h_inst_20200329T000000Z.nc
ngc2009_lnd_2d_30min_inst_20200329T000000Z.nc
ngc2009_atm_2d_30min_inst_20200329T000000Z.nc
ngc2009_oce_0-200m_3h_inst_1_20210329T000000Z.nc
ngc2009_oce_0-200m_3h_inst_2_20210329T000000Z.nc
ngc2009_oce_moc_1d_mean_20210329T000000Z.nc
ngc2009_oce_2d_1d_mean_20210329T000000Z.nc
ngc2009_oce_ml_1d_mean_20210329T000000Z.nc
ngc2009_oce_2d_1h_mean_20210329T000000Z.nc
...
$ ls *.nc | wc -l
12695now: a single dataset
- provides an easy-to-understand overview
- forces consistency across output
- cutting things is easier than glueing things
now: a single dataset

getting the data
model resolution
| Grid | Cells |
|---|---|
| 1° by 1° | 0.06M |
| 10 km | 5.1M |
| 5 km | 20M |
| 1 km | 510M |
| 200 m | 12750M |
| Screen | Pixels |
|---|---|
| VGA | 0.3M |
| Full HD | 2.1M |
| MacBook 13’ | 4.1M |
| 4K | 8.8M |
| 8K | 35.4M |
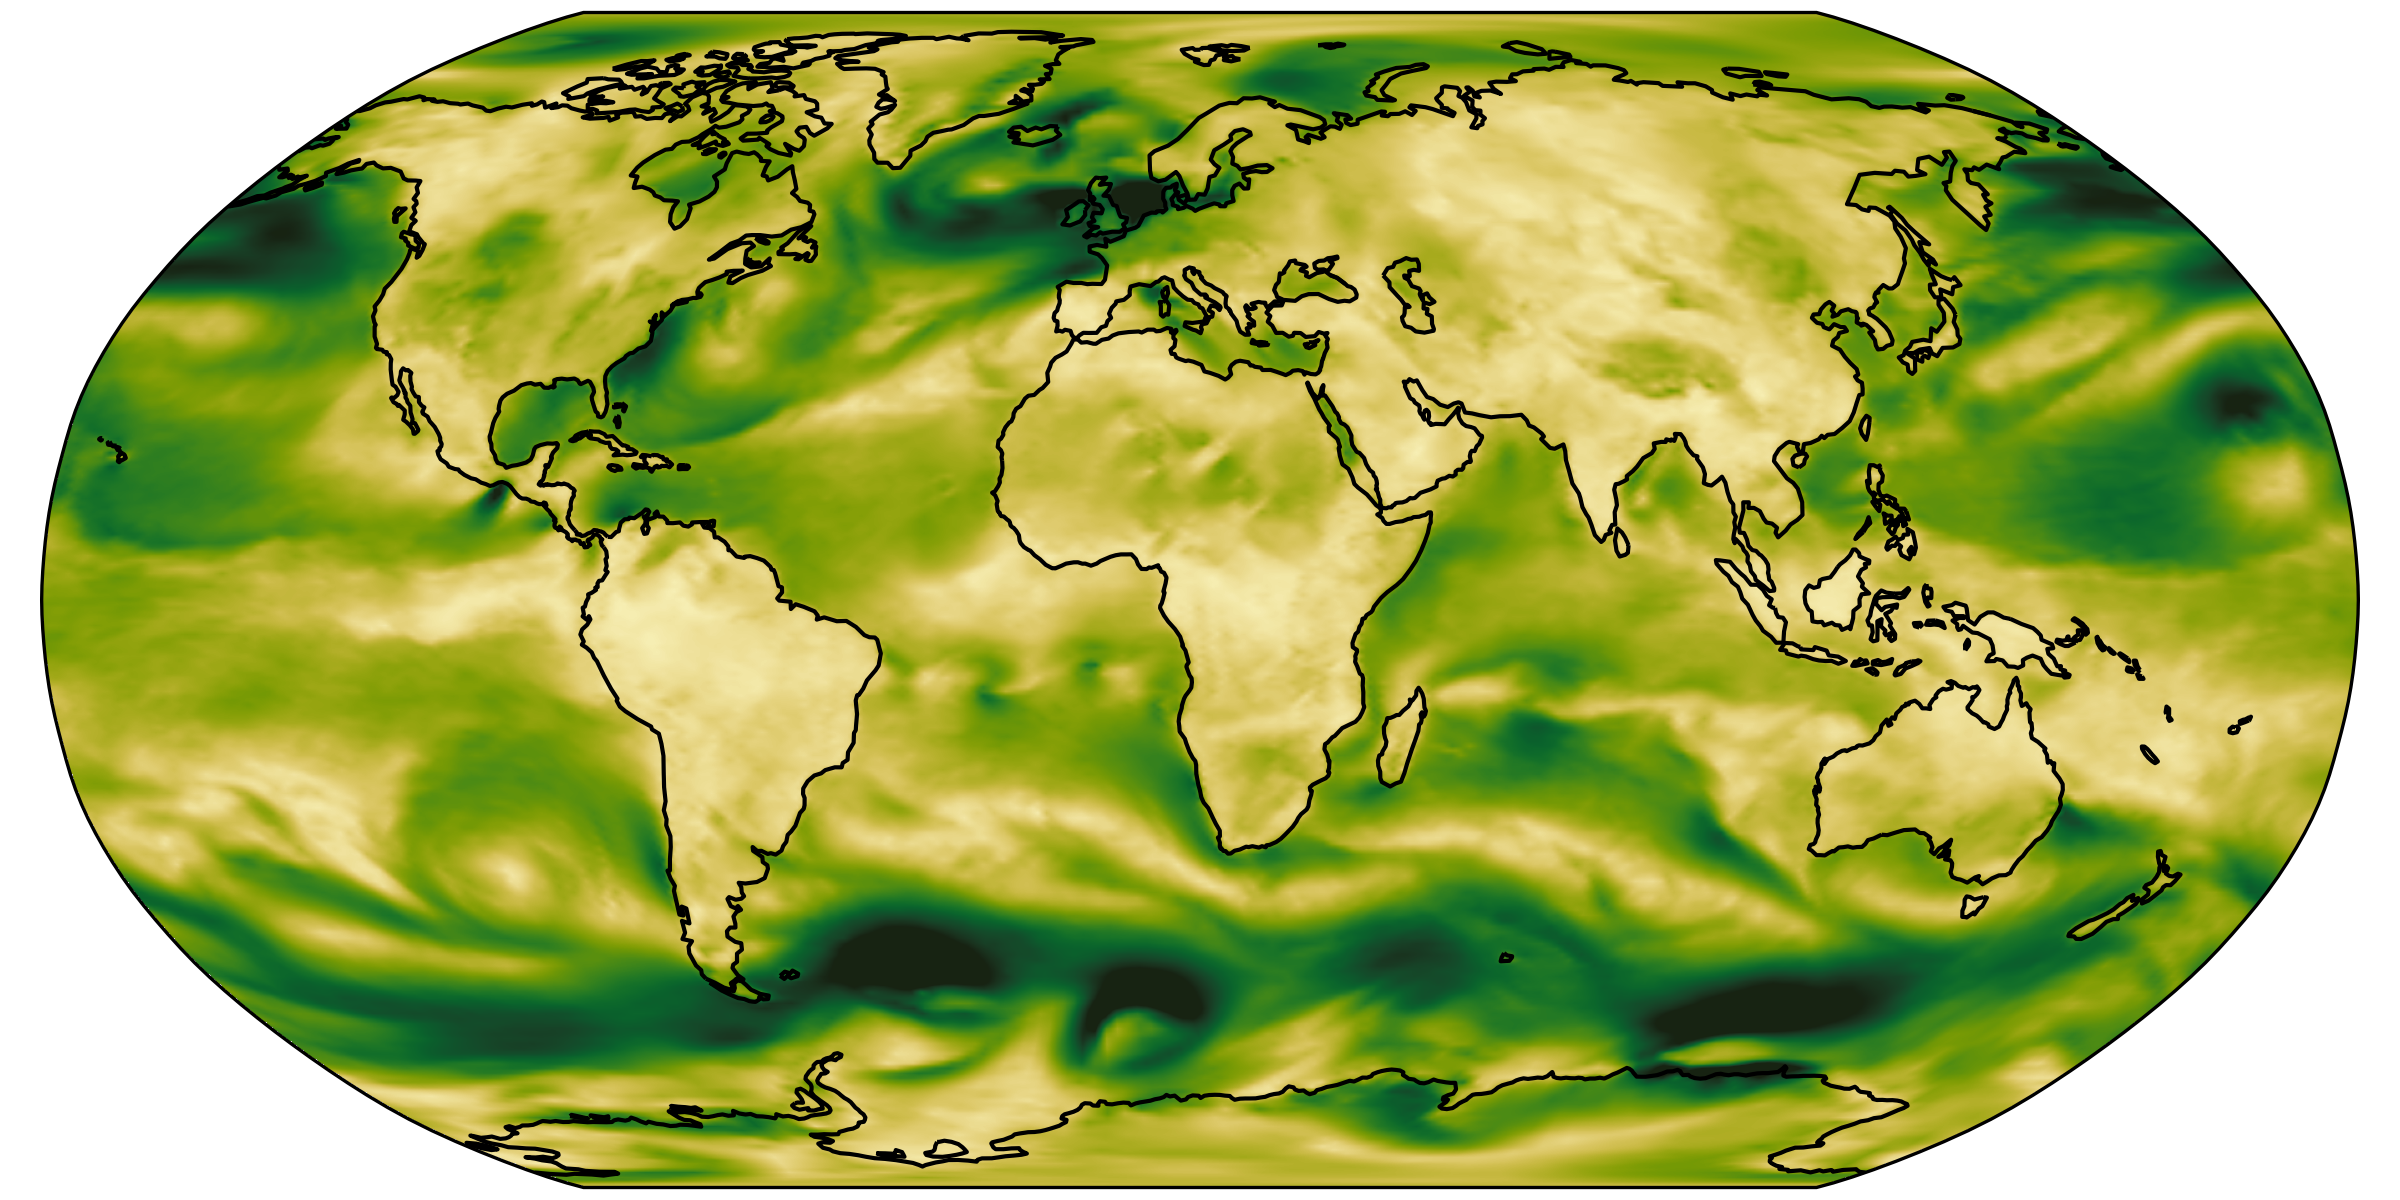
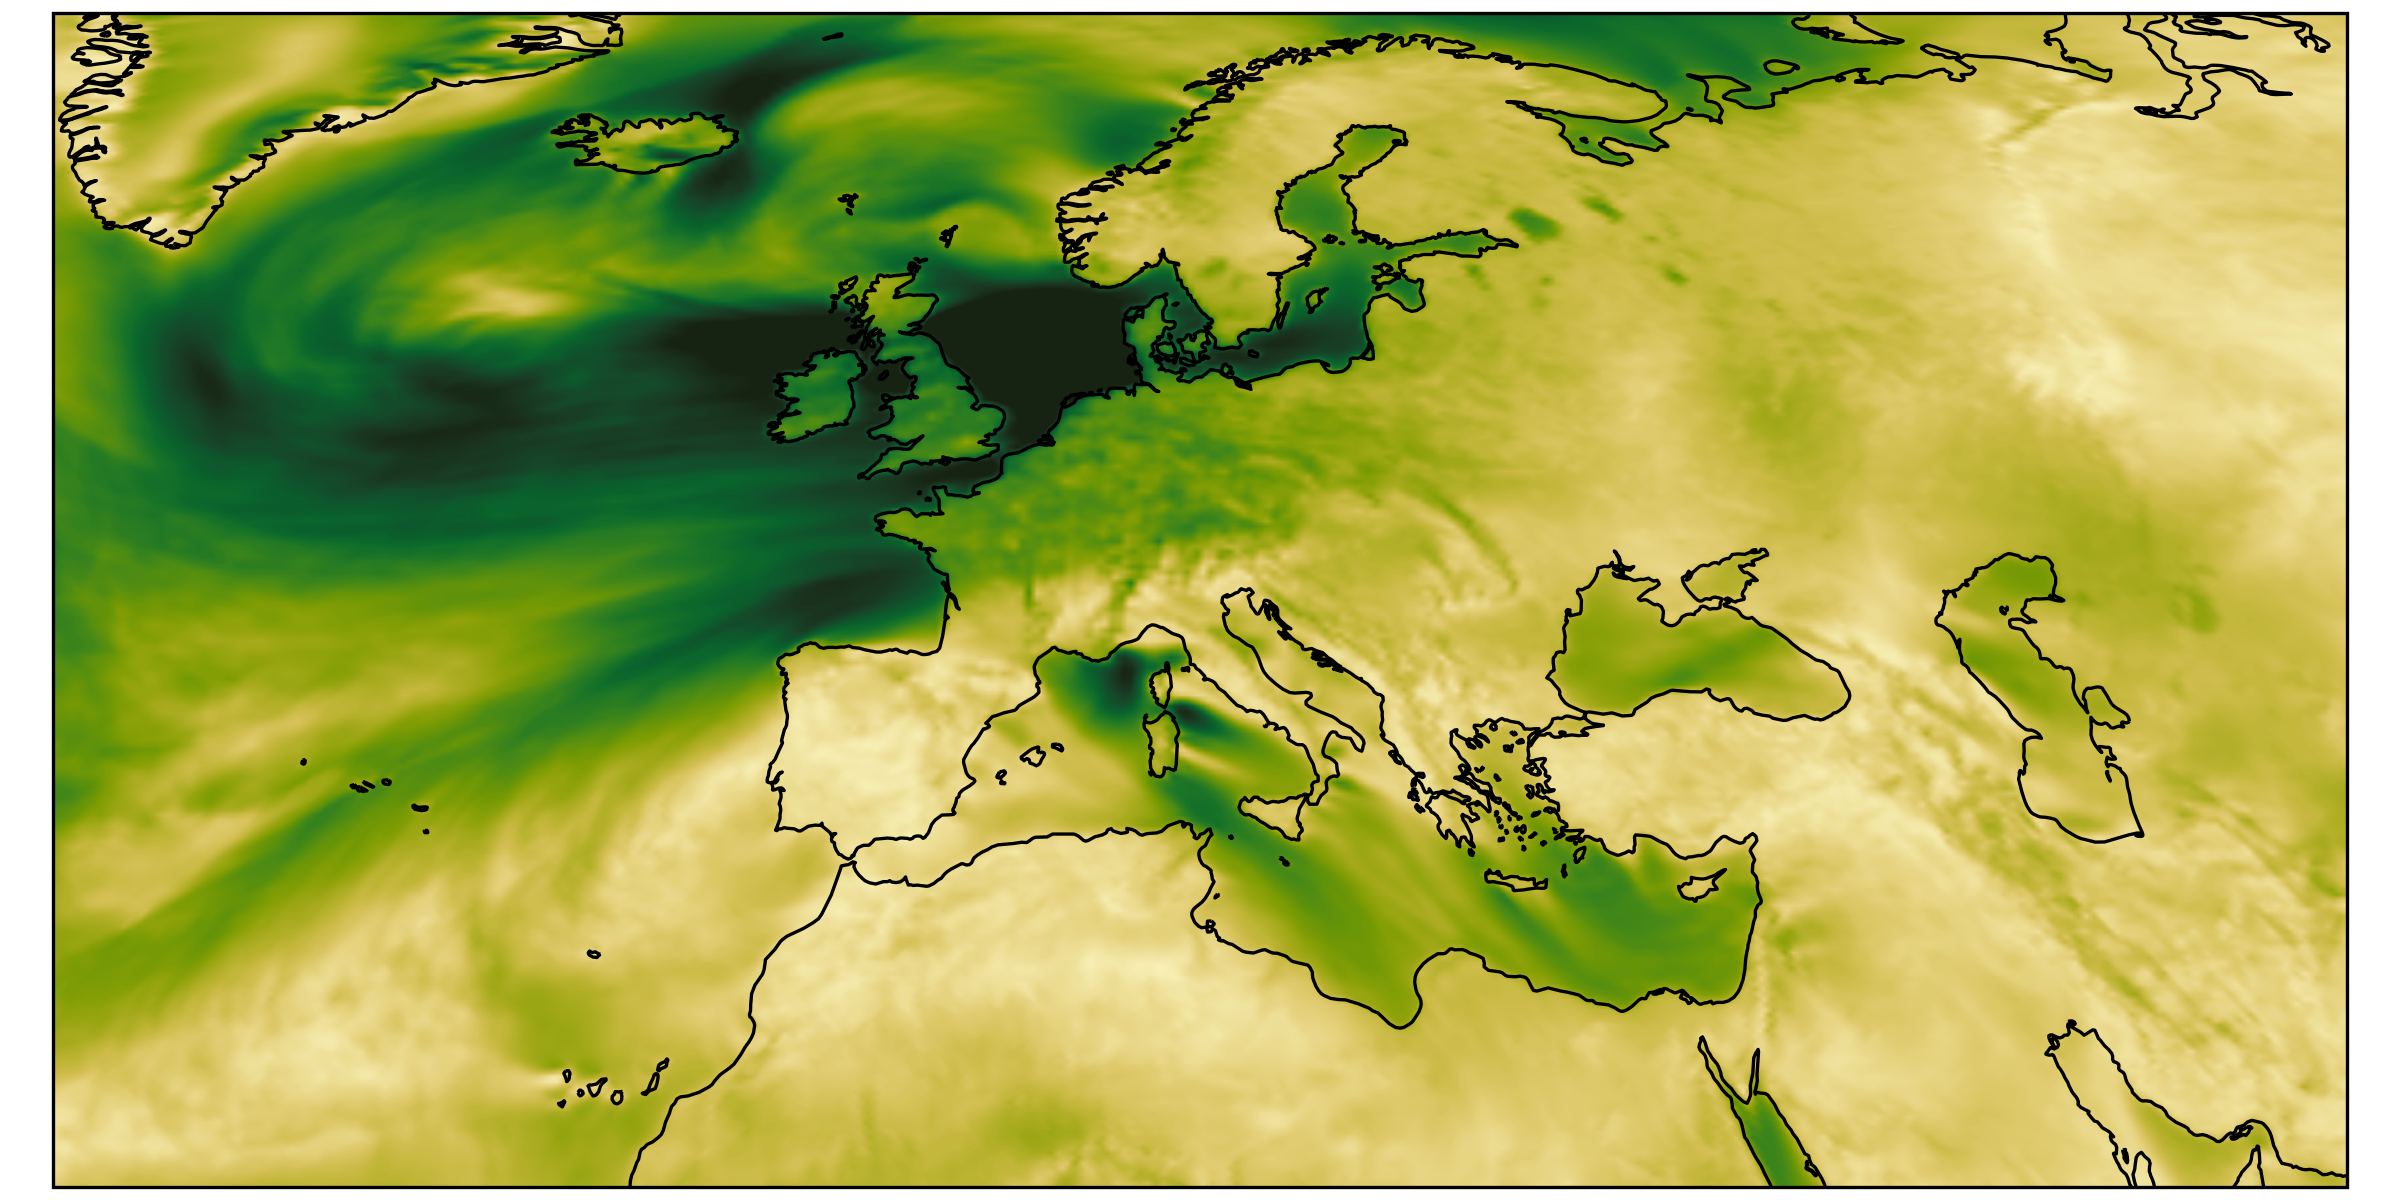
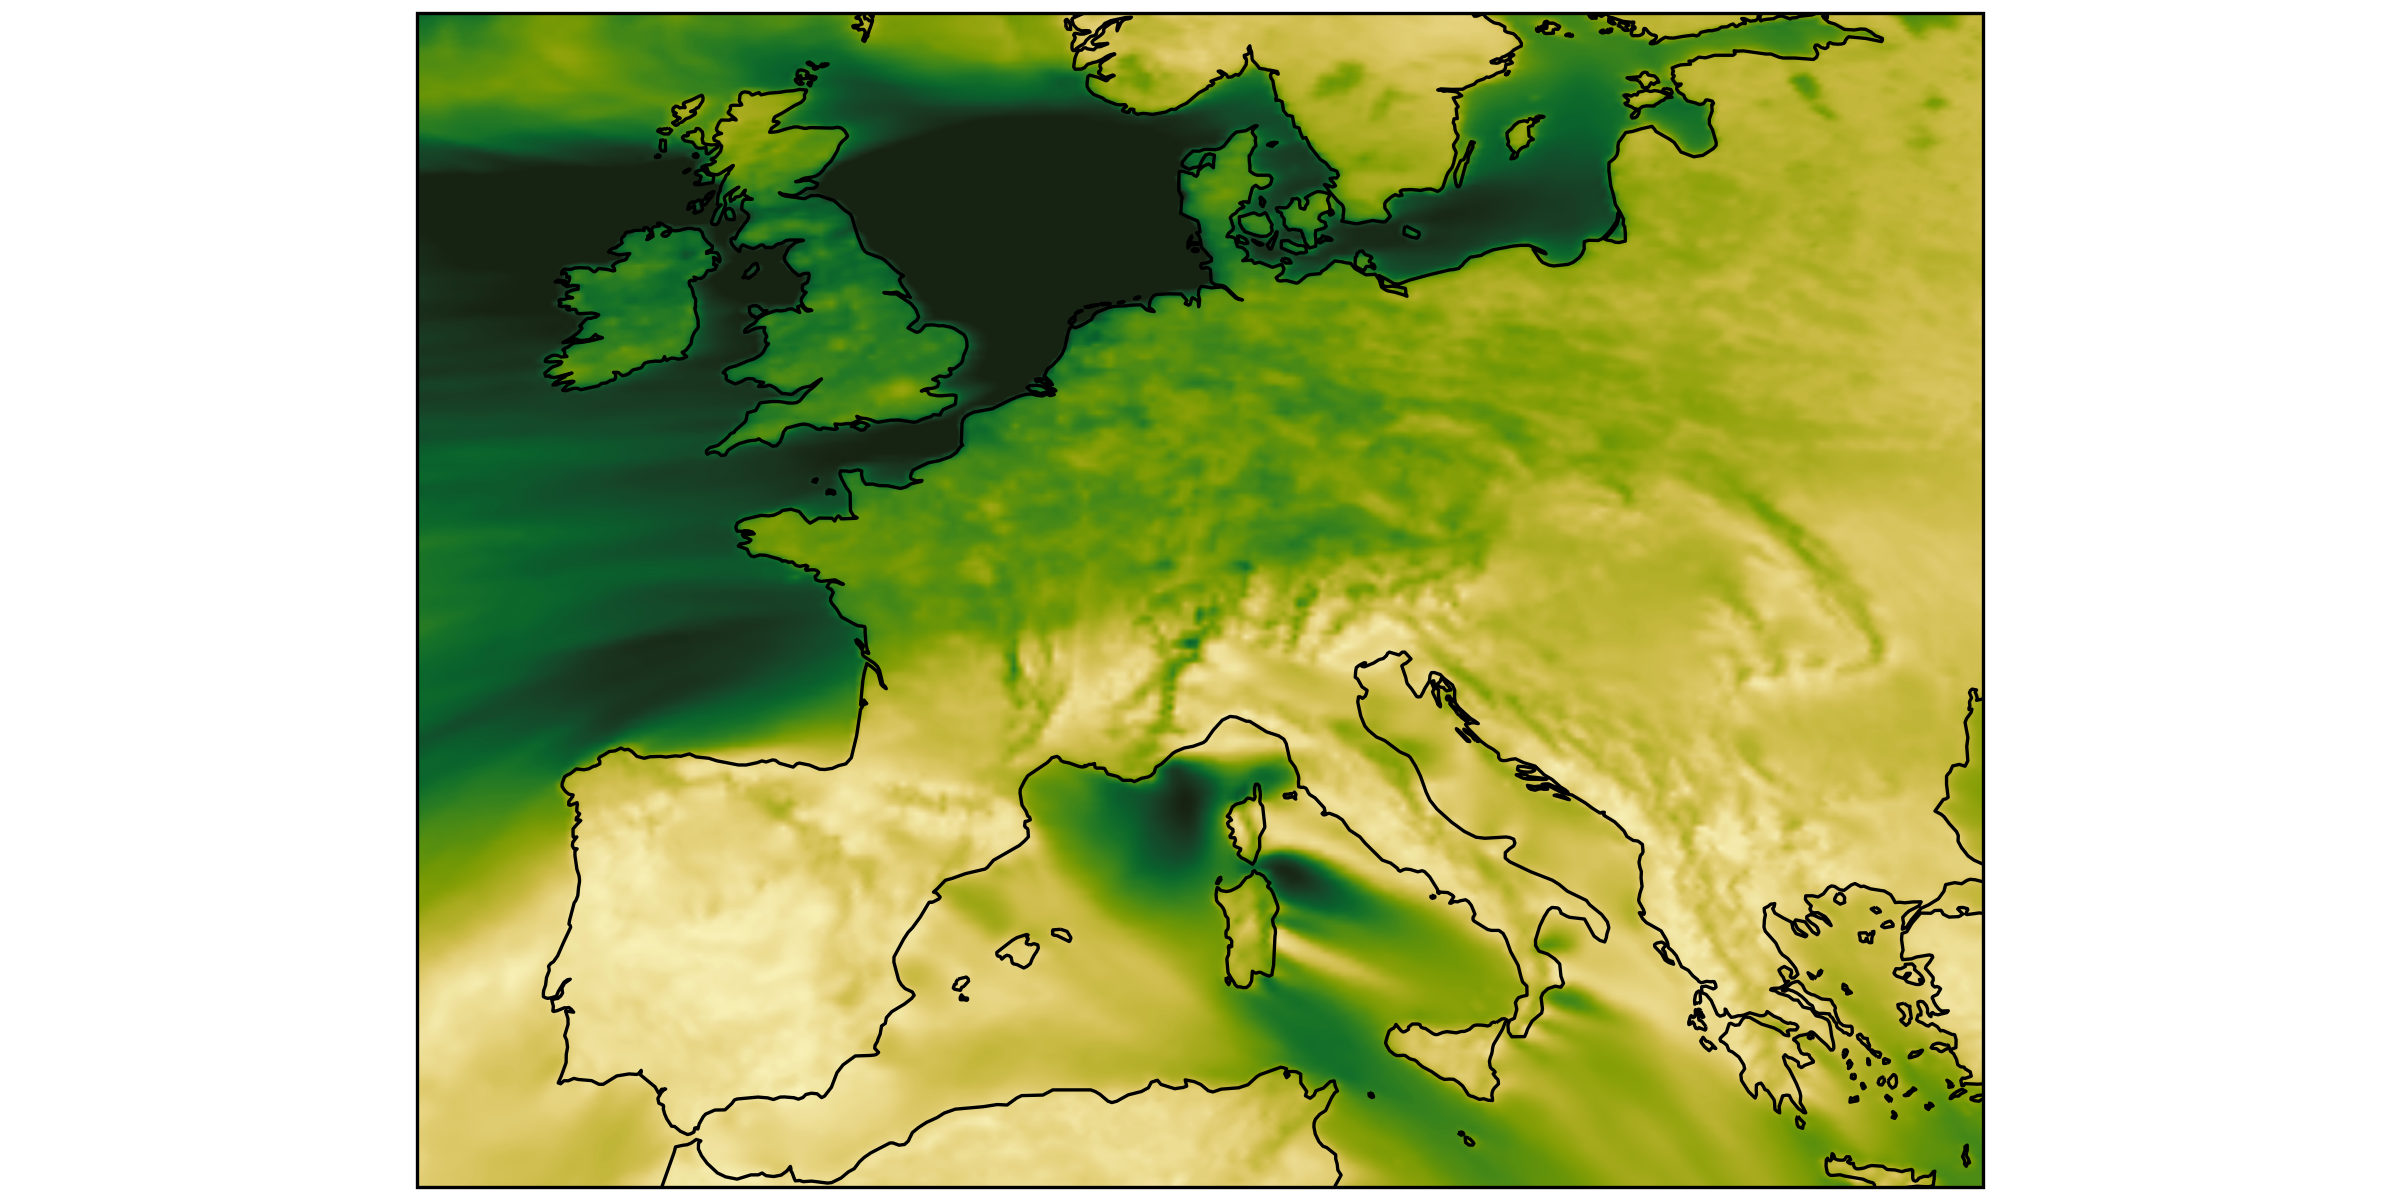
It’s impossible to look at the entire globe in full resolution.
different regions, same size
we had: over-loading
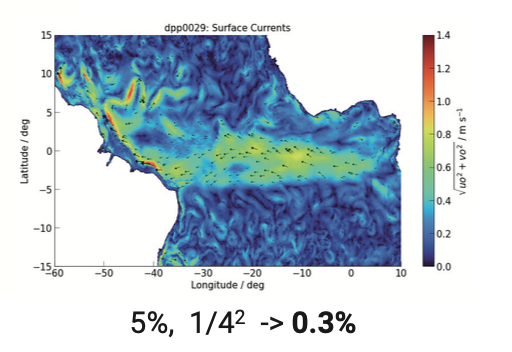
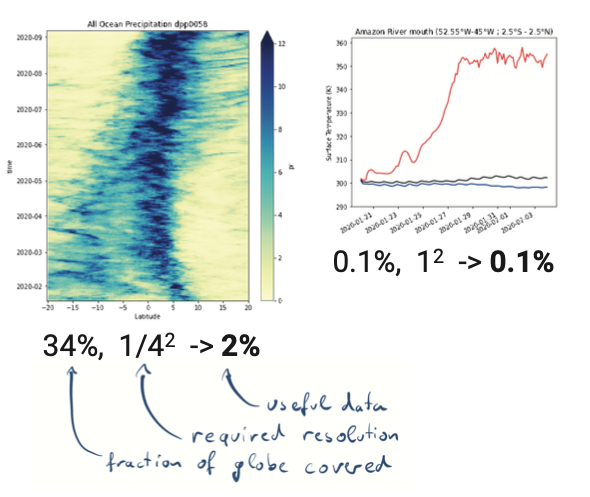
Analysis scripts are forced to load way too much data.
Plots by Marius Winkler & Hans Segura
now: aggregation

now: chunking

hierarchies
scale analysis with screen size
(instead of with model size)
about HEALPix
- Hierarchical
- Equal Area
- isoLatitude
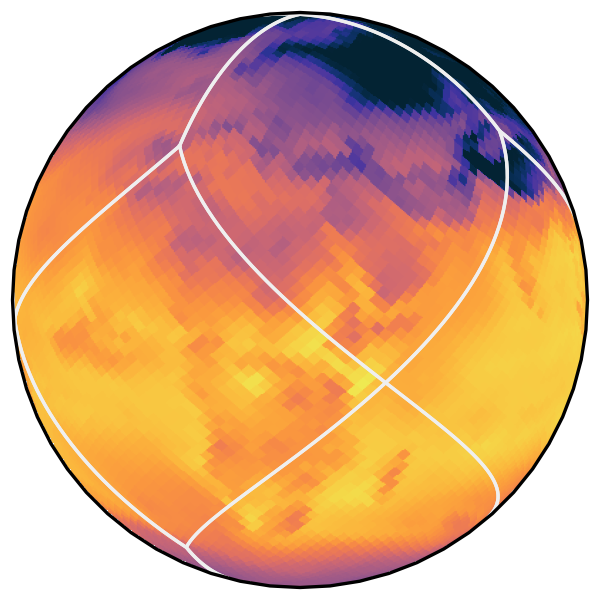
Not necessary for the aforementioned.
… but aligns very well.
about HEALPix
… but aligns very well.
- exact 1:4 grid cell relation between levels
- direct index computation from lat/lon
- index is space-filling curve
coding the analysis
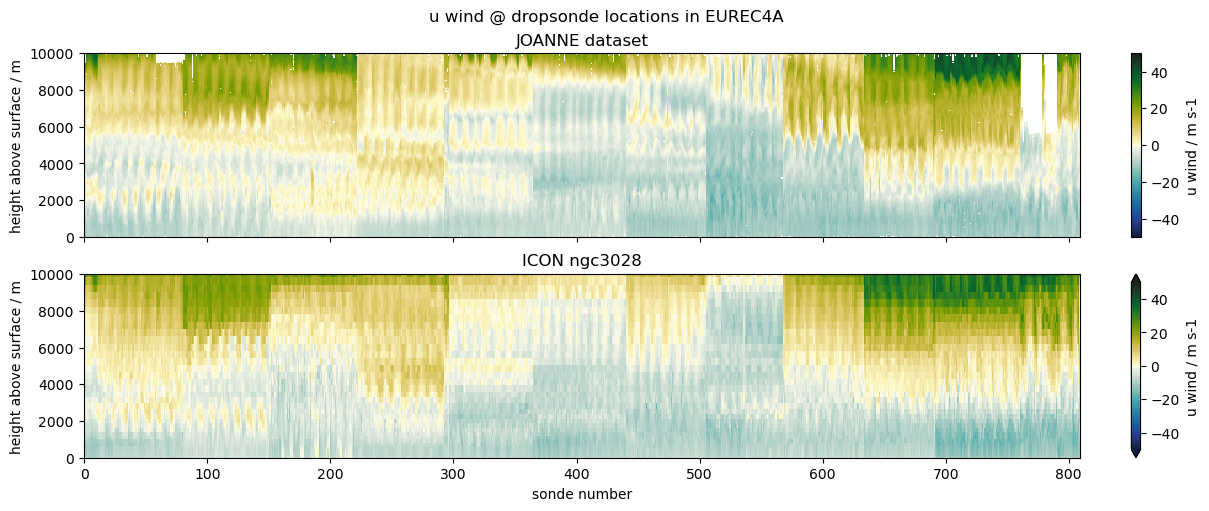
dropsonde vs model
Select ICON model output at all
dropsonde locations during EUREC4A field campaign:
sonde_pix = healpix.ang2pix(
    icon.crs.healpix_nside, joanne.flight_lon, joanne.flight_lat,
    lonlat=True, nest=True
)

icon_sondes = (
    icon[["ua", "va", "ta", "hus"]]
    .sel(time=joanne.launch_time, method="nearest")
    .isel(cell=sonde_pix)
    .compute()
)
(55 sec, 1GB, single thread, full code at easy.gems)
dropsonde vs model
direct output
direct output
- output process is coupled to the running model
- writes entire hierarchy at once
- dataset is accessible as soon as the model starts
does it really work?
monitoring
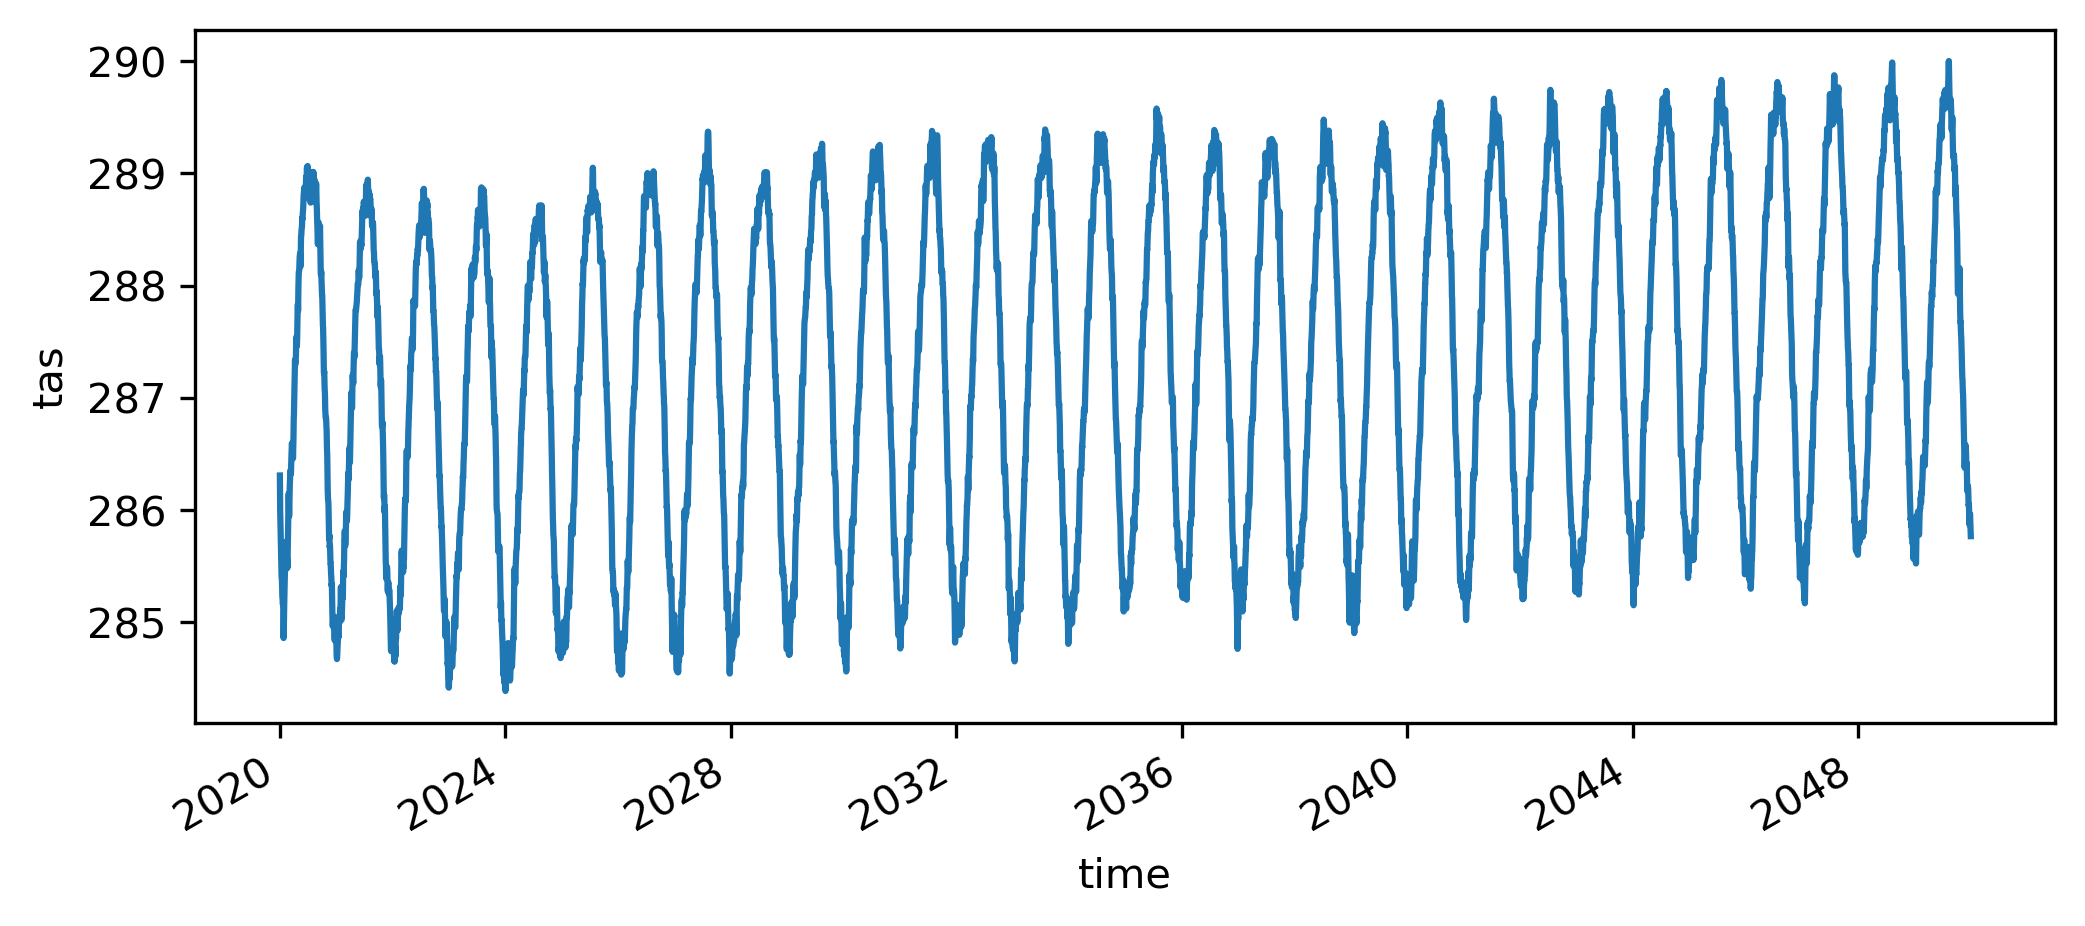
(100ms, 250MB, single thread)
exploring 5km global output
hackathons
Output tested on multiple \(\mathcal{O}(\textrm{PB})\)-scale model runs, 100+ users:
- remarkably little issues raised
- very positive general feedback
- enabled diagnostics which seemed impossible before
